Connect to a Linux host
Add an SSH connection to a host using systemd. Your remote account must be allowed to read the journal; Lognivo cannot elevate its permissions.
 lognivoGet Lognivo
A service restart and an application error tell different parts of the story. Read the remote journal beside your application output while you diagnose the failure.
Find your planRead the practical guide ↗SSH / Linuxsystemd / journalapplication.loglognivoOne workspace. Separate panels.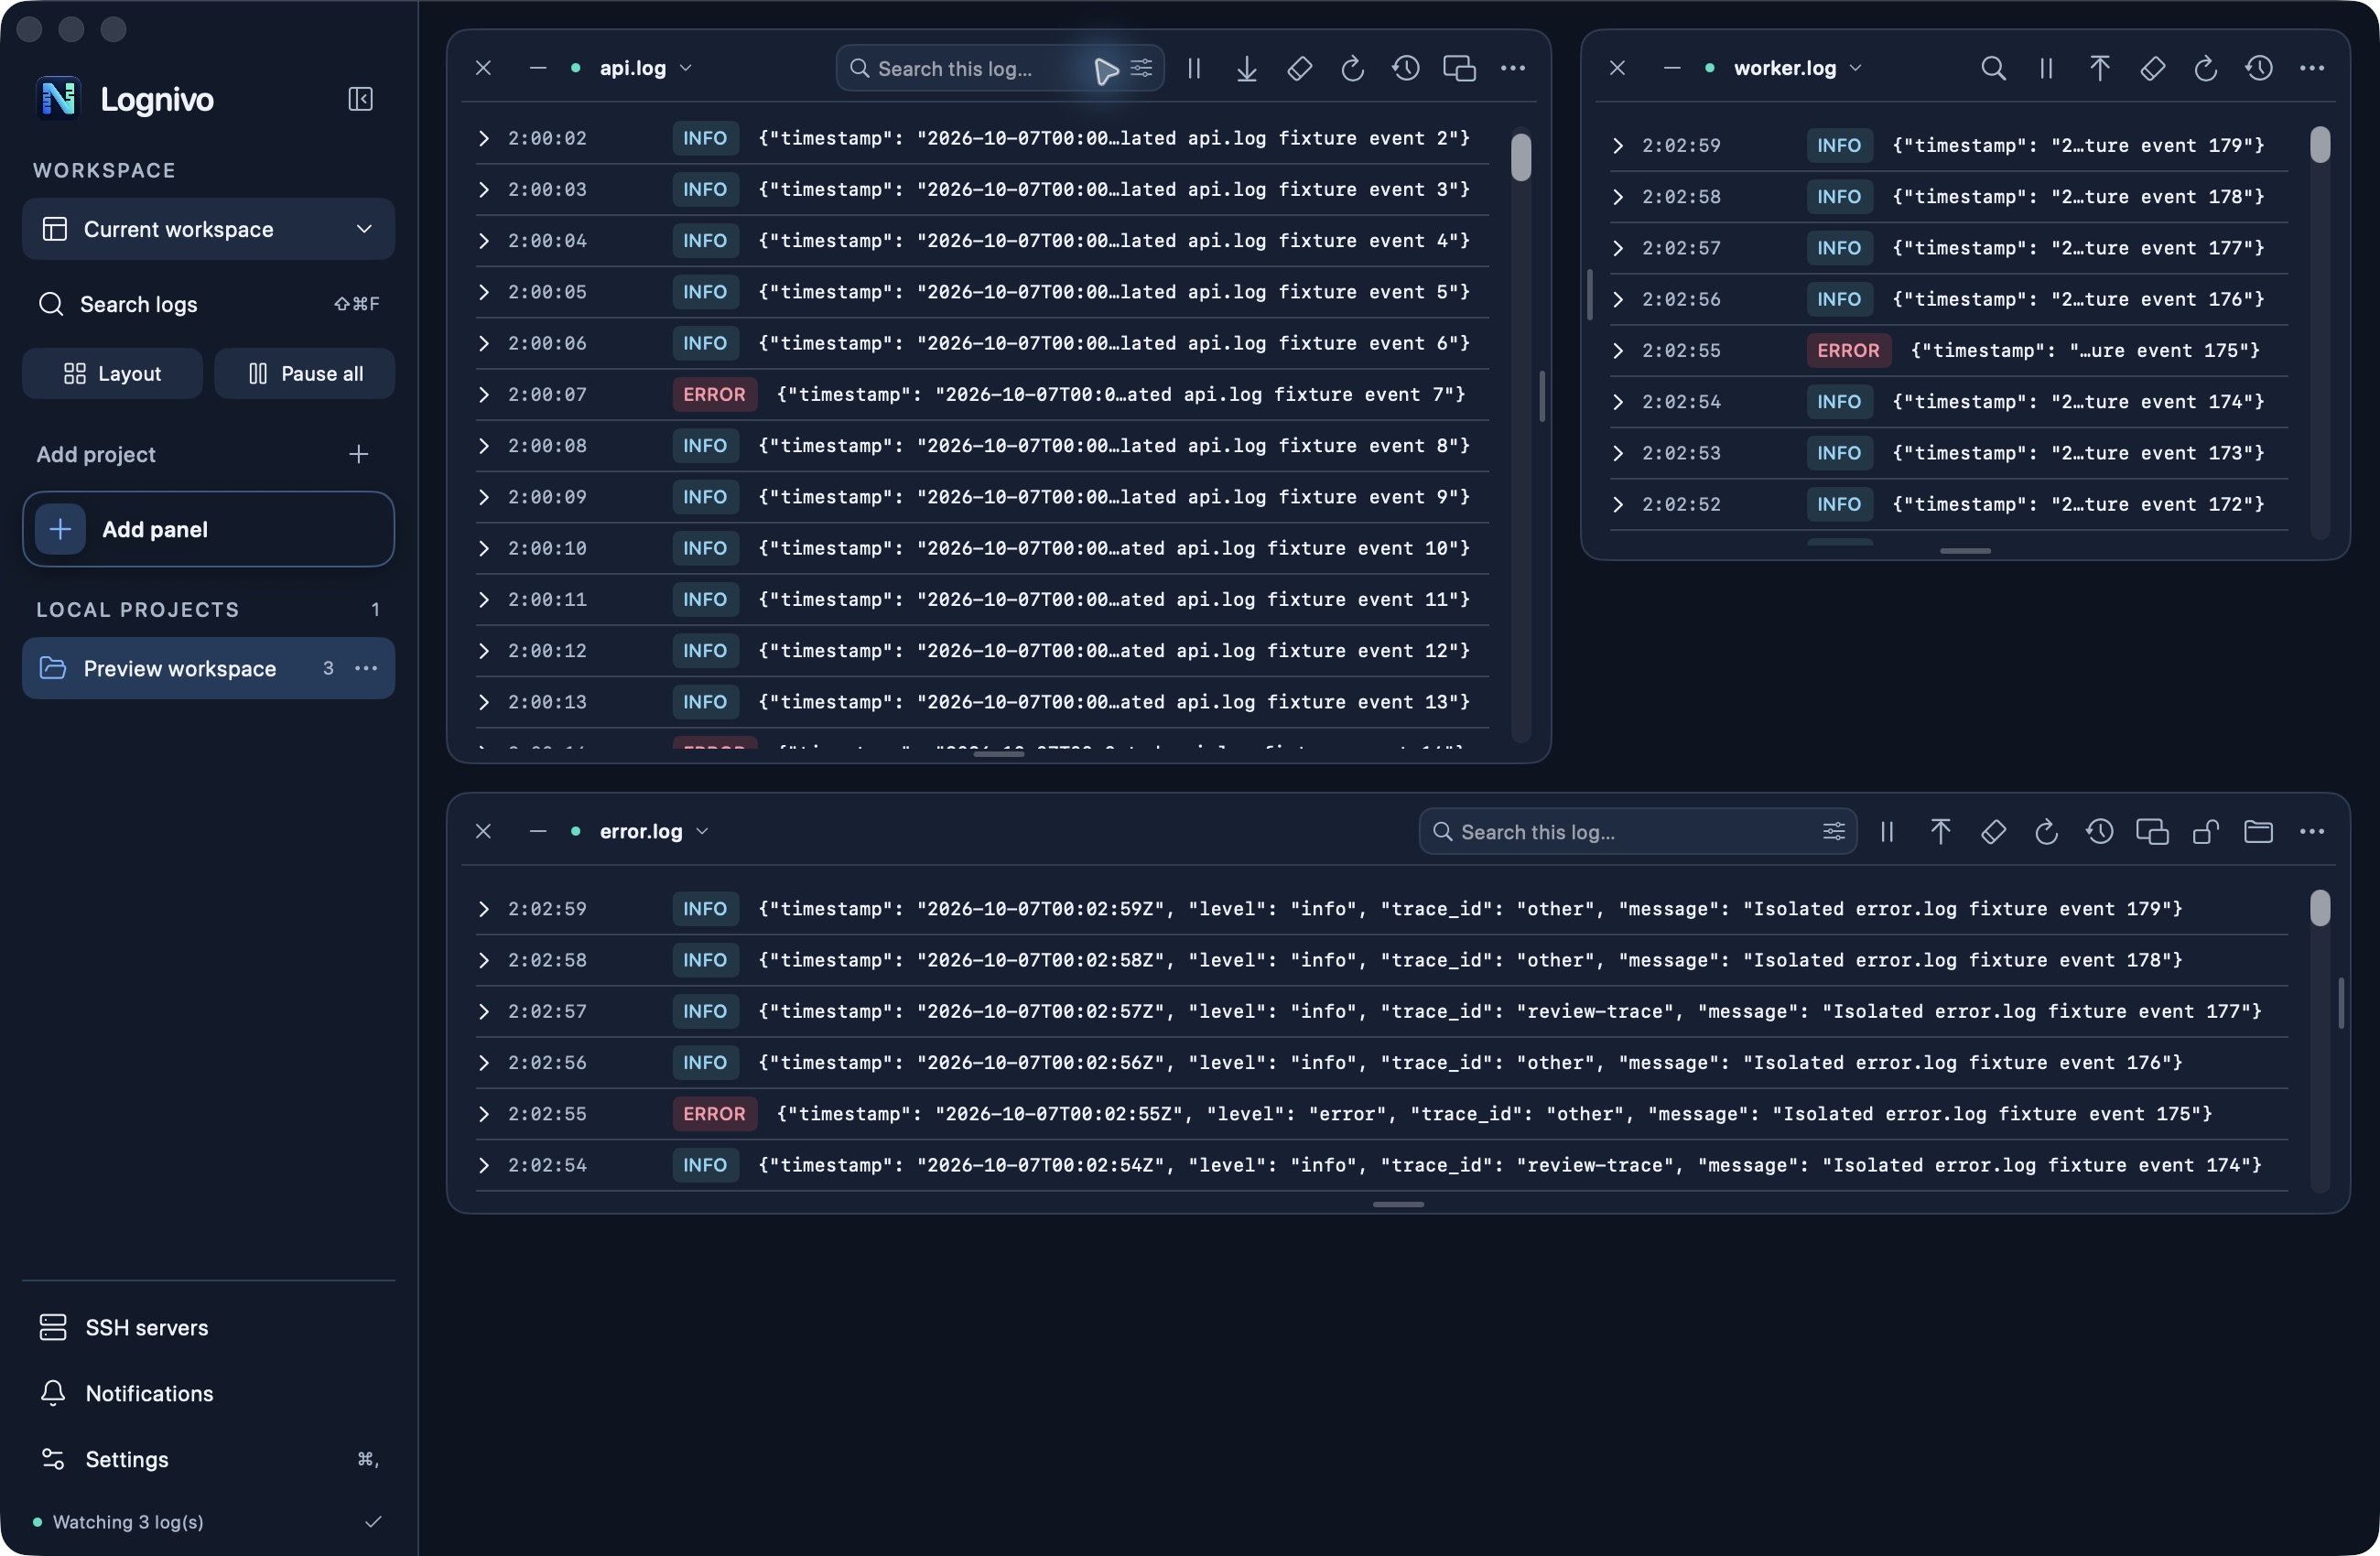
Add an SSH connection to a host using systemd. Your remote account must be allowed to read the journal; Lognivo cannot elevate its permissions.
Select the journal source you need and bring it into a panel. Keep relevant application text logs nearby, so service lifecycle events do not lose their application context.
Follow live output, pause to read and search the current buffer. Lognivo is an interactive desktop tool, not an always-on incident detection service running on the server.
Search, severity filters, reading order and pause stay with their panel. As you resize, secondary actions move into the options menu.
The Lognivo app runs on macOS 14 or later. It connects to supported remote Linux log sources over SSH.
No. Live monitoring requires the Mac app to be running and the feeds to be open and unpaused. Use server-side monitoring for continuous alerting.
macOS 14+ · Apple silicon & Intel
Get Lognivo for Mac