Find the WordPress project
Lognivo recognizes WordPress projects from wp-settings.php and looks in wp-content among its common log directories. You can always open a readable text log directly if the site uses a custom location.
 lognivoGet Lognivo
A plugin warning, a failed request and a PHP error can live in different files. Put the WordPress debug log beside your server log and work through the evidence.
Find your planRead the practical guide ↗wp-content/debug.logPHP / error.logweb / error.loglognivoOne workspace. Separate panels.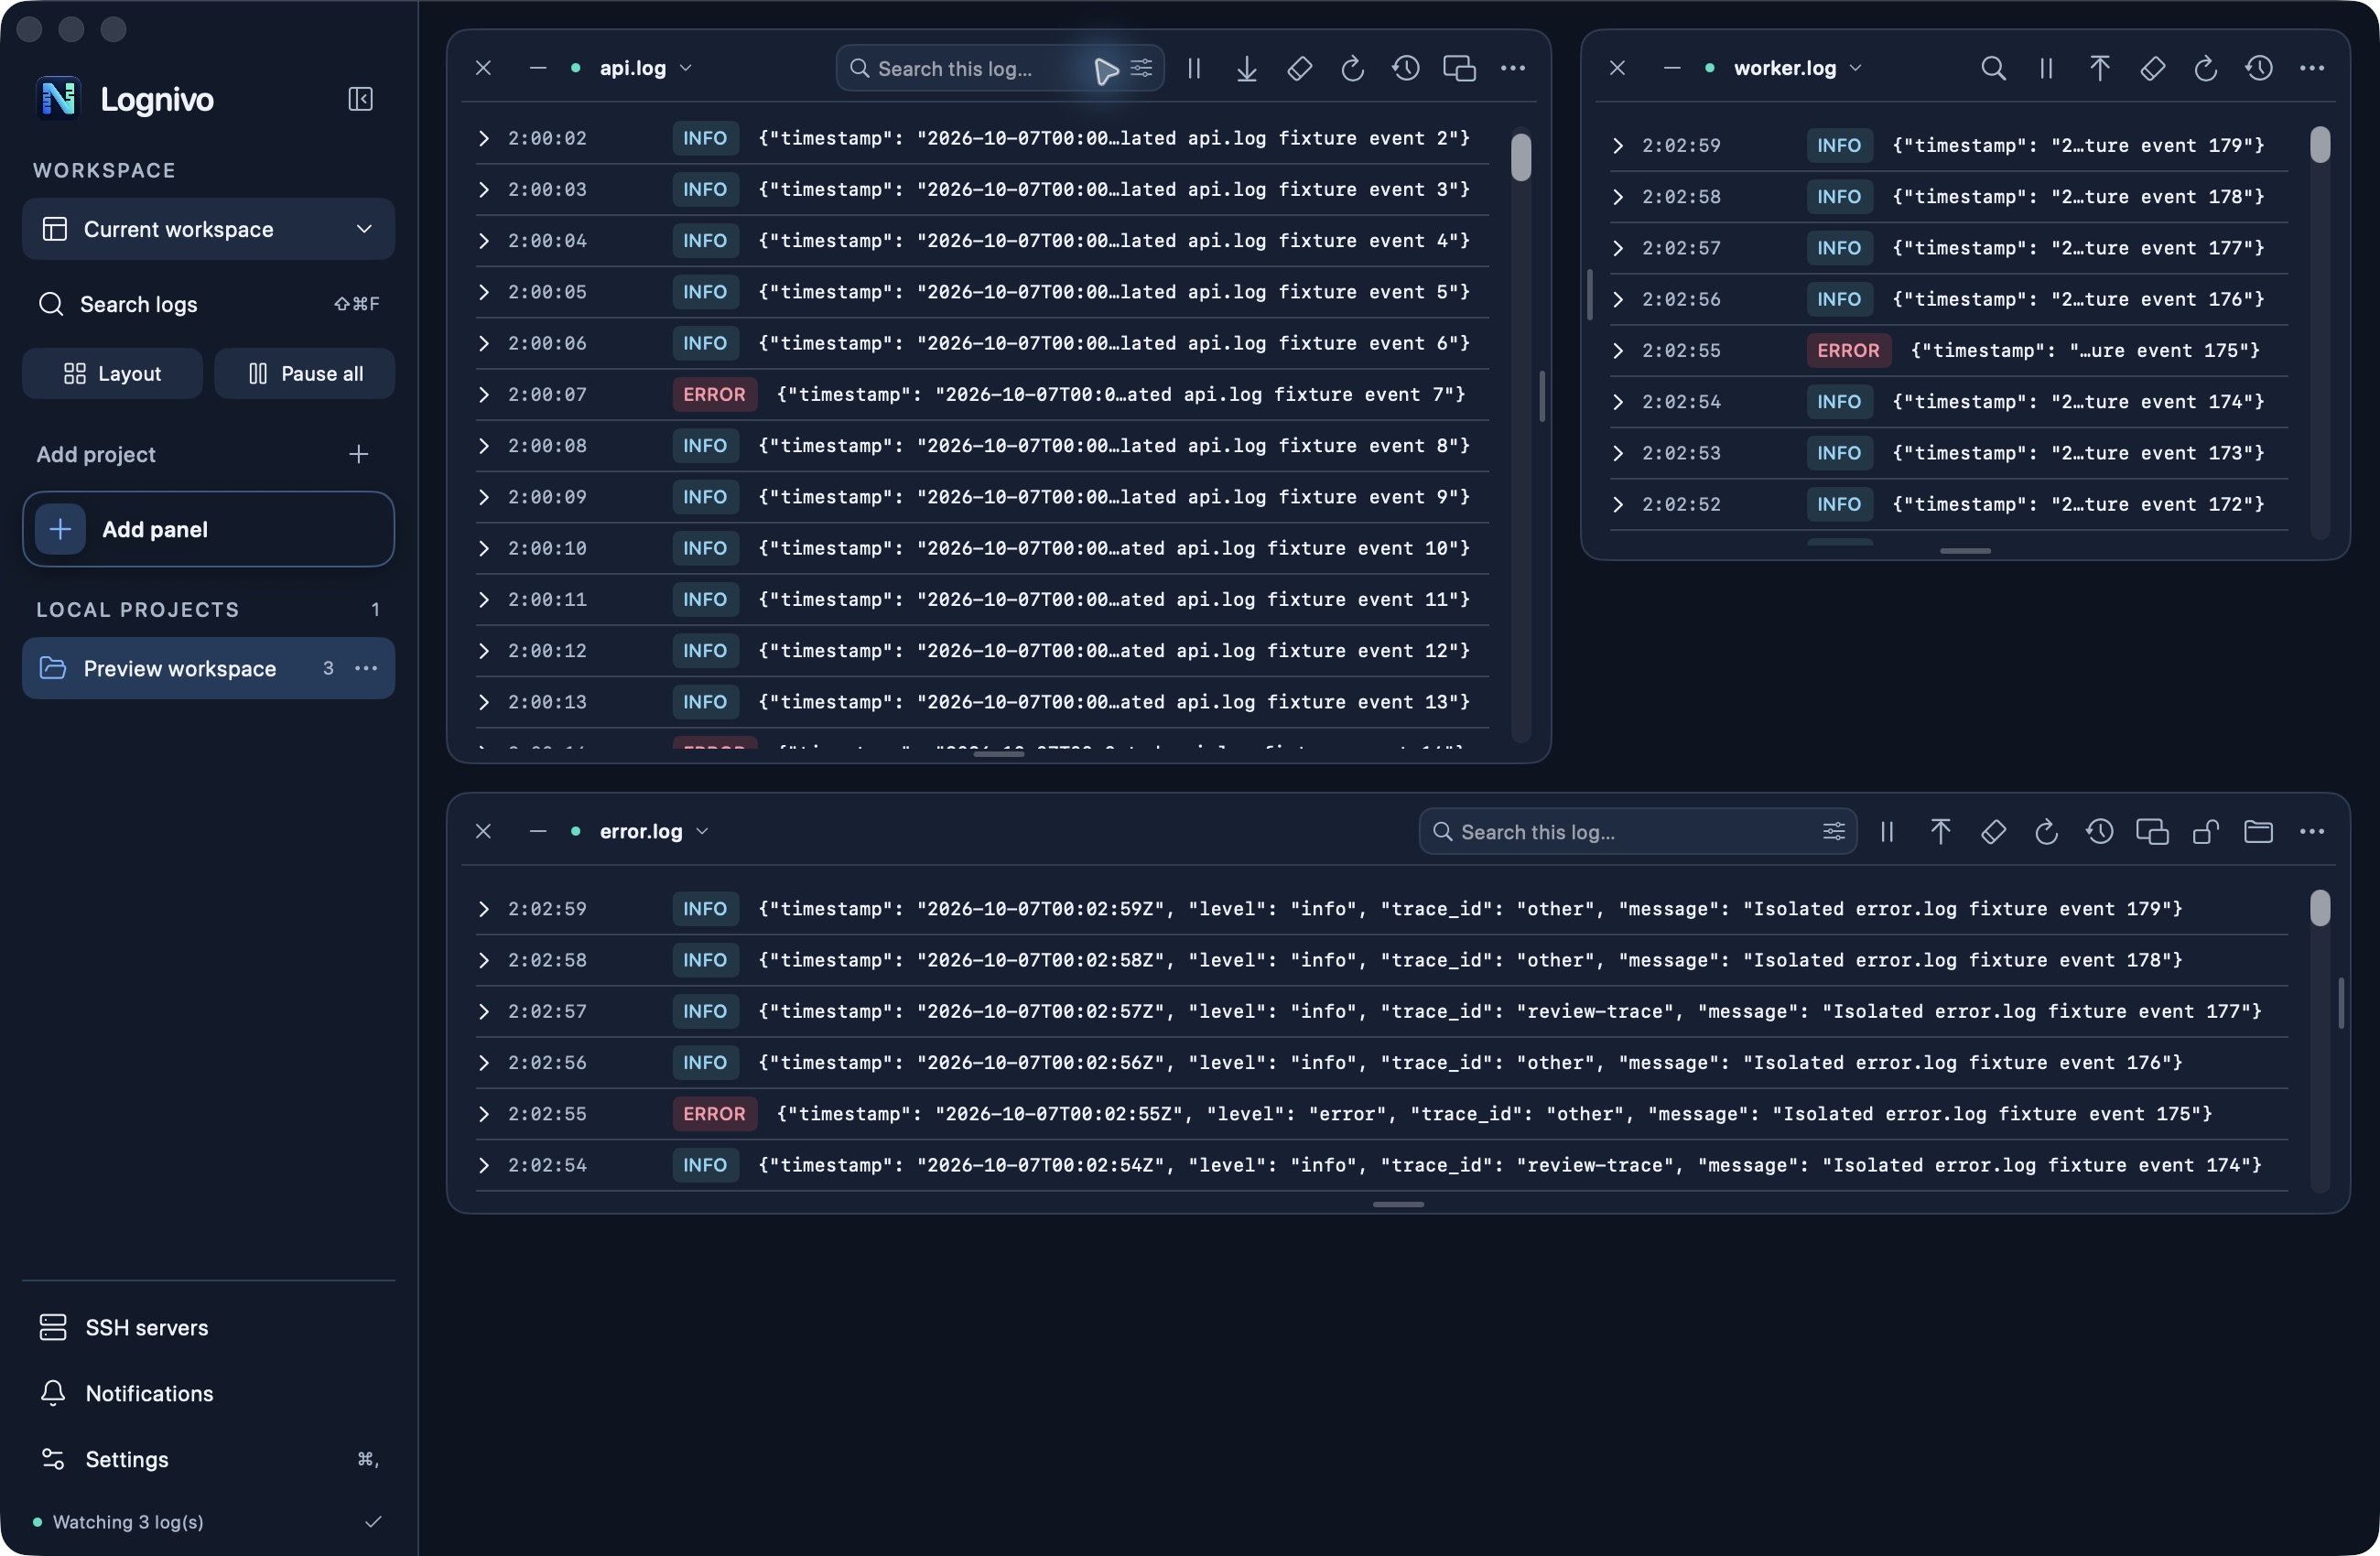
Lognivo recognizes WordPress projects from wp-settings.php and looks in wp-content among its common log directories. You can always open a readable text log directly if the site uses a custom location.
When WordPress debug logging is configured, select its debug.log file. Add the PHP error log as another panel. Search a plugin directory name or the error message to narrow the investigation.
Read local development logs or connect to a server where your SSH user can access the files. Lognivo does not enable WordPress debugging or modify wp-config.php for you.
Search, severity filters, reading order and pause stay with their panel. As you resize, secondary actions move into the options menu.
No Lognivo plugin is required. The app reads existing text logs locally or over SSH. WordPress itself must be configured to write the log you want to inspect.
Check your WordPress debug configuration, file permissions and configured log path. Start on a development or staging site. The guide explains the standard configuration and why the file may not exist yet.
macOS 14+ · Apple silicon & Intel
Get Lognivo for Mac